 产品
产品
 咨询
咨询 帮助
帮助
 光纤光栅传感器
当前位置:主页 > 技术支持 > 工程结构健康监测技术 >
技术支持分类
Bridge Structural Monitoring System of DATAQ Instruments
- 作者:聚华信息官
- 发表时间:2019-08-12 15:07
- 来源:光纤光栅传感器专家
Distributed Synchronous Ethernet Data Acquisition Systems Satisfy Demanding I35W St. Anthony Falls Bridge Health Measurements
Roger W. Lockhart
Overview
The collapse of the I-35W Mississippi River Bridge in Minneapolis, Minnesota on August 1, 2007 was a calamity of huge proportion. Carrying over 135,000 vehicles daily, the bridge failed during the evening rush hour resulting in thirteen fatalities and 145 injuries. Almost immediately plans were formulated for a replacement bridge, which subsequently opened on September 18, 2008. But unlike its ill-fated predecessor the new I-35W Saint Anthony Falls Bridge is designed with an integral state-of-the-art monitoring system that continuously assesses bridge integrity to ensure that a catastrophic failure will not repeat. That monitoring system was implemented using DATAQ Instruments' Distributed Ethernet data acquisition products, which provide the optimal blend of data acquisition power with the ability to capture measurements across the bridge's immense 1,200-foot length.
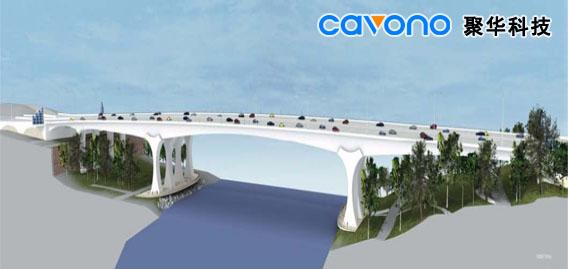
Figure 1 - An artist's conception of the new I35W St Anthony Falls Bridge (courtesy Minnesota Department of Transportation
What to measure, and where to measure it?
Many requisite issues needed to be addressed by the data acquisition system that the Minnesota Department of Transportation (MDOT) deployed to monitor bridge vital signs. Chief among these was the need to establish a framework of sensor types and their specific location on the bridge to yield optimal diagnostics.
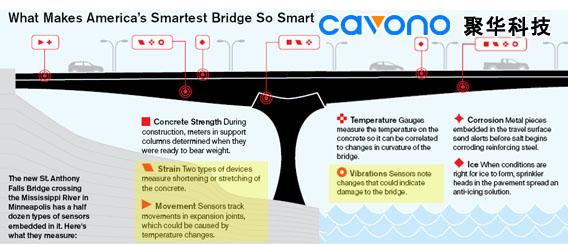
Figure 2 - The I35W Saint Anthony Falls Bridge was featured in BusinessWeek magazine's Smart Infrastructure series in the March 2, 2009 issue. Highlighted in yellow are the measurements made by DATAQ Instruments data acquisition
They decided on a mix of sensor types that would provide both snapshots and long-term trends of bridge status (see Table 1).
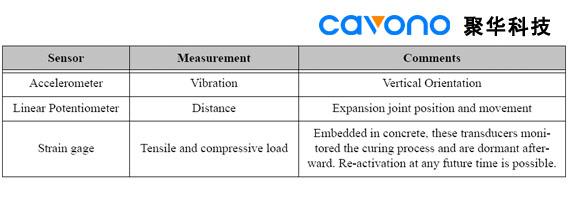
Table 1 - The range of sensor types that are deployed in multiple locations on the I-35W Bridge. This range of sensors needed to be deployed across the bridge's span in strategic structural locations for optimal results. For this purpose the bridge's 1,200-foot span was mapped into eight nodes. Each node can be thought of as a cluster of sensors, either of the same or different type.
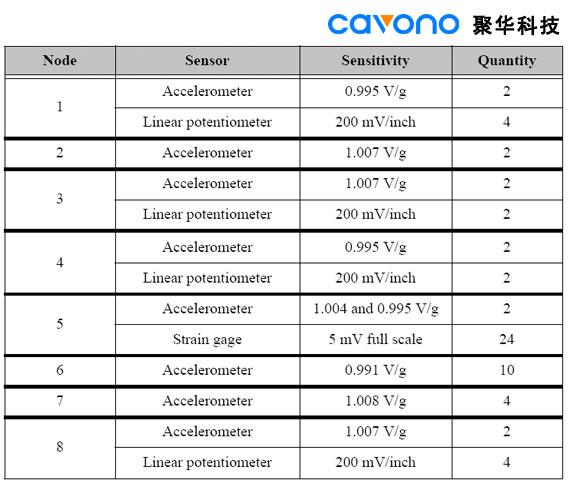
Table 2 describes how sensors are allocated between each of the eight nodes.
Table 2 - Nodes were established on the bridge at strategic locations to ensure worst case measurements, and sensors with the indicated output levels were allocated to the nodes depending upon measurement requirements.
To identify specific node locations the bridge is divided into northbound and southbound lanes, and major structural supports are denoted as abutments and piers. Beginning at the south end of the bridge and moving in a northbound direction, the order is abutment 1, pier 2, pier 3, pier 4, and abutment 5. Figure 3 provides a schematic view of the bridge that includes structural and node (Nx) locations as well as the distances between them. Nodes not located directly on a pier are placed at the centerline between structural supports (the theoretical weakest point) for a worst-case measurement.
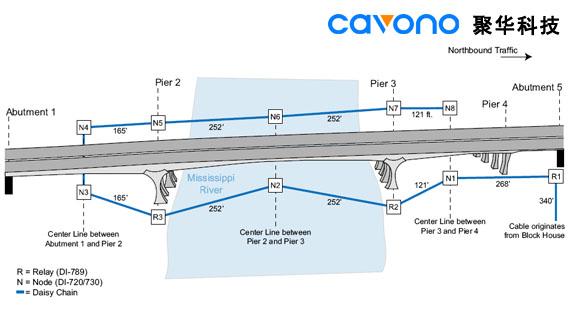
Figure 3 - Schematic representation of the location of eight instrumentation nodes (Nx) and relays (Rx) used to monitor bridge health.
Data acquisition challenges require unique solutions
Measurement nodes are sensor clusters of as many as twenty-six devices, and as you can see from Figure 3, the distances between measurement nodes can be great. Further, the plan was to establish a computer system in a blockhouse that is located approximately 340-feet from the northbound exit of the bridge. The computer would connect to a data acquisition system and provide 24/7/365 monitoring of bridge condition with remote access. This created two major data acquisition problems for the application that needed to be solved before the goal of a monitoring system for the I-35W Bridge could be realized.
The total number of channels that needed to be acquired was sixty-two, which is not an over whelming number given contemporary data acquisition solutions. However, running signal leads from sixty-two sensors to one central location is not practical. The optimal location for a single data acquisition system is at the middle of the bridge (at nodes 2 or 6), and as can be seen from Figure 3, this would result in signal paths that exceed 400 feet in some cases. The typical millivolt-level signals would experience line loss and induced noise over this distance that would degrade measurements to the point of making them useless for the purpose intended. Further, stringing shielded, multi-conductor signal cable over such a great distance is problematic and costly. For these reasons a single data acquisition approach was abandoned.
A second option was to install a data acquisition system at each measurement node, resolving the problems created by one centralized data acquisition system. Signal cable lengths would be minimized, and connecting them to the data acquisition system over these short distances would
be both practical and cost-effective. But the problem was how to synchronize eight data acquisition systems distributed across over 1,800 feet of northbound and southbound bridge segments.
The need for channel synchronization is crucial to the success of subsequent data analysis and bridge performance interpretation. Each one of the sixty-two measured channels needs to be acquired in a predictable time slot relative to the others. Without this, an event on one channel cannot be interpreted in terms of other channels, so the effect of that event on the bridge's structure as a whole is lost forever. It would be like trying to interpret a verbal sentence where the words arrive at your ear in a different order than when they were spoken.
Although the synchronization problem is inherently solved with one centralized data acquisition system, it's a major challenge to synchronize multiple systems spread out over 1,800 feet.
Synchronous Data Acquisition Using Ethernet
The ideal instrumentation solution for the I-35W Bridge allows one data acquisition system per node to maintain signal integrity and low cabling cost, and also provides the ability to synchronize between multiple systems that are dispersed across the eight measurement nodes with over 2,000 feet separating the data gathering computer and the last node. DATAQ Instruments' synchronous Ethernet data acquisition products provided such a solution.
DATAQ Instruments' OEM type DI-5001 data acquisition cards were supplied with Ethernet interfaces, one per data acquisition node. Each board supports 32 analog channels to accommodate one sensor input per channel, and features dual RJ45 connectors that allow standard CAT-5 Ethernet cable to simply daisy chain between the eight DI-5001 boards, one per instrument node. This approach keeps transducer signal leads short, substituting low cost CAT-5 Ethernet cable for the long runs between nodes. The daisy chained Ethernet approach also solved other problems. It supports modularity and expansion so that nodes could be easily swapped, added or removed to increase or decrease node count, as the application requires. The fact that Ethernet is an isolated standard means that data communication reliability is bulletproof even in the presence of common mode voltages. Finally, it allows exceedingly long communication cable lengths of up to 100 meters between units. Since the data acquisition system's synchronous interface provides a built-in Ethernet switch, the distance between individual nodes, and between them and the block house can be as long as 100 meters.
The synchronizing mechanism incorporates two unused CAT-5 cable pairs. One pair carries a master 16 MHz clock, and the second carries a trigger signal. The clock is daisy-chained between DI-5001 units, and the Ethernet interface of each unit incorporates a phase lock loop (PLL) that provides failsafe operation and exactly reproduces the master clock with zero phase delay. The failsafe feature is a unique aspect of the PLL that ensures that lock is maintained in the event of momentary, or even longer-term interruptions in the daisy-chained master clock. The incorporation of PLLs into the Ethernet interface of each DI-5001 ensures that each data acquisition unit remains precisely synced to the master clock in frequency as well as in phase, thereby guaranteeing synchronous analog to digital conversions between individual units and between individual channels. The addition of a master trigger signal on the second CAT-5 cable pair completes the picture to ensure that all units in the distributed chain initiate sampling at the same instant, unencumbered by network latencies.
Referring again to Figure 3, in situations where distances between nodes or the computer exceed 100 meters, a relay is used to bridge the gap. Model DI-789 relays, denoted as Rx in Figure 3, are specially designed to carry data and synchronous timing signals between nodes and ultimately to the connected computer for display and storage.
Data Acquisition Software
The transducers and the hardware used to achieve synchronous operation is only half of the solution. Also required was continuous monitoring of the bridge, 24/7/365. That meant a dedicated computer running software that is able to deliver a continuous stream of acquired data from each instrumentation node to the computer's hard drive for permanent storage. The result would be large data files that require an efficient method to review data.
DATAQ Instruments' WinDaq software provided a solution that satisfied the need to acquire data continuously from each node though use of its disk streaming capability. Each channel of every node is continuously sampled, some as fast as 1 kHz, yielding approximately 2 GB data files each day after data reduction, and each value in the resulting data files is time and date stamped to correlate any given event with an actual date and time of occurrence.
Reviewing data is fast and efficient through the use of WinDaq software's playback component. Specific events can be easily identified and exported to other applications for further analysis. Figure 4 is a compressed playback screen showing the northbound progression of a large vehicle across the bridge the afternoon of March 30, 2009. Starting at the bottom of the screen, moving toward the top, and correlating it with the bridge schematic of Figure 3, we can clearly see that the vehicle is first detected by node 3 accelerometers on the first bridge span (SP1, channels 6 and 5), then by node 2 accelerometers on the second bridge span (SP2, channels 4 and 3), and finally by accelerometers of node 1 on the third and final bridge span (SP3, channels 2 and 1).
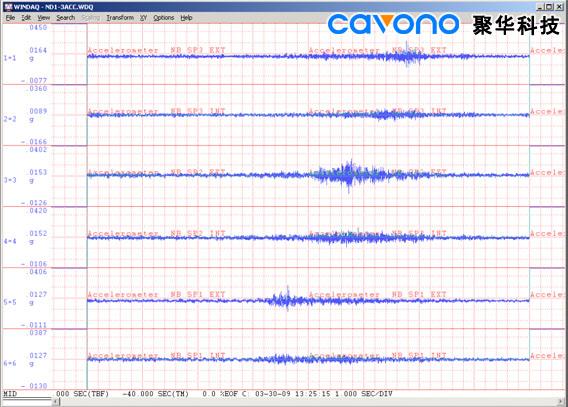
Figure 4 - The progression of a lone heavy vehicle traveling northbound on the I35W Bridge as detected by accelerometers at instrument nodes 3, 2, and 1 (refer to Figure 3).
In another example, Figure 5 details the movement with temperature of three northbound and two southbound bridge expansion joints over a twenty-four hour period. The measurements were taken from several linear potentiometers (LPs) calibrated in inches. Beginning again at the bottom of the screen and moving up, first are the LPs of node 4 that measure the expansion of span 1 southbound lanes (SP1, channels 6 and 5). Next are node 4 LP sensors that measure complementary positions on the northbound lanes (SP1, channels 4 and 3). And finally node 1 LP sensors measuring expansion joint activity for northbound lanes at span 3 (SP3, channels 2 and 1).
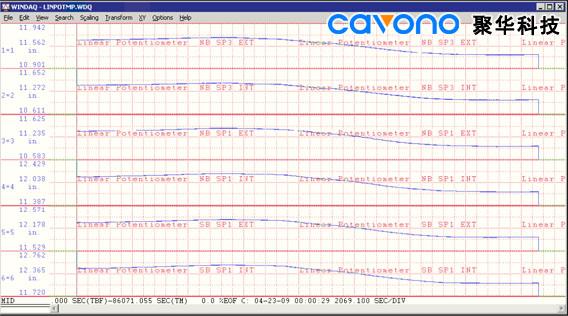
Figure 5 - The activity of expansion joints as a function of temperature as measured by linear potentiometers over a twenty-four hour period. Measurements were taken at nodes 1 and 4 (see Figure 3).
A final example of day-to-day activities on the I35W Bridge and the sensitivity of the instruments that detect them can be found in Figure 6. The havoc created by a snowplow at 7:32 AM on April 6, 2009, as detected by an accelerometer located at node 3 in the northbound lanes, can be seen in the enclosed box. Compare the enclosed section with the relative calm both before and after the plow passes in this highly compressed plot.
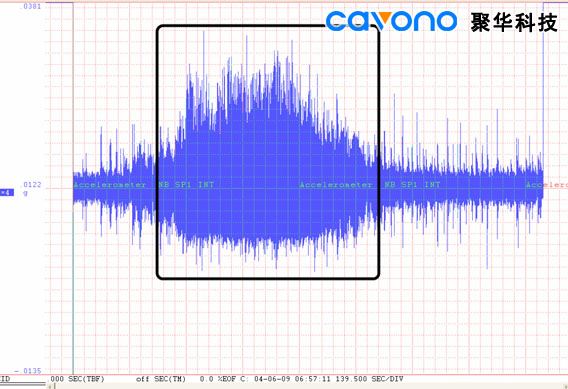
Figure 6 - The activity of a snowplow on April 6, 2009 at 07:37 AM is detected by an accelerometer located on the first span of the northbound lanes at instrument node 3.
Conclusions
Constant monitoring of Saint Anthony Falls Bridge vital signs will provide unprecedented insight to bridge condition for the life of the structure. The evaluation of wear and tear no longer needs to be solely a subjective manual inspection exercise. Now it can be supplemented by quantitative analysis that evaluates bridge performance on an annual, monthly, and even daily basis if necessary, making manual modes of inspection that much more productive. Advanced data acquisitions systems are at the heart of this process. Due to the constraints of bridge length and the number and diversity of measurement points and types, only a synchronous data acquisition system could produce meaningful results. Ethernet data acquisition products by DATAQ Instruments fulfilled this requirement with hardware and software solutions that will generate multi-channel data files describing bridge condition far into the future.
(信息来源:DATAQ Instruments)
关于结构健康监测
结构健康监测是指对工程结构实施损伤检测和识别。 我们这里所说的损伤包括材料特性改变或结构体系的几何特性发生改变,以及边界条件和体系的连续性,体系的整体连续性对结构的服役能力有至关重要的作用。 结构健康监测涉及到通过分析定期采集的结构布置的传感器阵列的动力响应数据来观察体系随时间推移产生的变化,损伤敏感特征值的提取并通过数据分析来确定结构的健康状态。对于长期结构健康监测,通过数据定期更新来估计结构老化和恶劣服役环境对工程结构是否有能力继续实现设计功能。
关于光纤光栅传感器
光纤光栅传感器(Fiber Grating Sensor )属于光纤传感器的一种,基于光纤光栅的传感过程是通过外界物理参量对光纤布拉格(Bragg)波长的调制来获取传感信息,是一种波长调制型光纤传感器。光纤光栅传感器可以实现对温度、应变等物理量的直接测量。由于光纤光栅波长对温度与应变同时敏感,即温度与应变同时引起光纤光栅耦合波长移动,使得通过测量光纤光栅耦合波长移动无法对温度与应变加以区分。因此,解决交叉敏感问题,实现温度和应力的区分测量是传感器实用化的前提。通过一定的技术来测定应力和温度变化来实现对温度和应力区分测量。这些传感器主要包括光纤光栅应变传感器、温度传感器、加速度传感器、位移传感器、压力传感器、流量传感器、液位传感器等。
关于聚华科技
杭州聚华光电科技有限公司(Cavono,Inc.)是一家基于物联网光纤传感器技术从事土木工程结构健康监测与预警管理的高新技术企业,聚华是光纤光栅传感器产品提供商和土木工程结构健康监测一站式解决方案优质合作伙伴。公司专注于桥梁、隧道、边坡、基坑、地铁、矿山、电力等土木工程领域的结构健康监测相关产品的研发、生产、推广与应用,以提供野外光纤传感器自动化监测产品、工程结构安全监测一站式解决方案见长。主要以光纤光栅传感器技术、分布式光纤测温技术、工程安全自动化云计算软件、工程化专业领域数据分析为技术核心。www.cavono.com www.juhualab.com
Roger W. Lockhart
Overview
The collapse of the I-35W Mississippi River Bridge in Minneapolis, Minnesota on August 1, 2007 was a calamity of huge proportion. Carrying over 135,000 vehicles daily, the bridge failed during the evening rush hour resulting in thirteen fatalities and 145 injuries. Almost immediately plans were formulated for a replacement bridge, which subsequently opened on September 18, 2008. But unlike its ill-fated predecessor the new I-35W Saint Anthony Falls Bridge is designed with an integral state-of-the-art monitoring system that continuously assesses bridge integrity to ensure that a catastrophic failure will not repeat. That monitoring system was implemented using DATAQ Instruments' Distributed Ethernet data acquisition products, which provide the optimal blend of data acquisition power with the ability to capture measurements across the bridge's immense 1,200-foot length.
Figure 1 - An artist's conception of the new I35W St Anthony Falls Bridge (courtesy Minnesota Department of Transportation
What to measure, and where to measure it?
Many requisite issues needed to be addressed by the data acquisition system that the Minnesota Department of Transportation (MDOT) deployed to monitor bridge vital signs. Chief among these was the need to establish a framework of sensor types and their specific location on the bridge to yield optimal diagnostics.
Figure 2 - The I35W Saint Anthony Falls Bridge was featured in BusinessWeek magazine's Smart Infrastructure series in the March 2, 2009 issue. Highlighted in yellow are the measurements made by DATAQ Instruments data acquisition
They decided on a mix of sensor types that would provide both snapshots and long-term trends of bridge status (see Table 1).
Table 1 - The range of sensor types that are deployed in multiple locations on the I-35W Bridge. This range of sensors needed to be deployed across the bridge's span in strategic structural locations for optimal results. For this purpose the bridge's 1,200-foot span was mapped into eight nodes. Each node can be thought of as a cluster of sensors, either of the same or different type.
Table 2 describes how sensors are allocated between each of the eight nodes.
Table 2 - Nodes were established on the bridge at strategic locations to ensure worst case measurements, and sensors with the indicated output levels were allocated to the nodes depending upon measurement requirements.
To identify specific node locations the bridge is divided into northbound and southbound lanes, and major structural supports are denoted as abutments and piers. Beginning at the south end of the bridge and moving in a northbound direction, the order is abutment 1, pier 2, pier 3, pier 4, and abutment 5. Figure 3 provides a schematic view of the bridge that includes structural and node (Nx) locations as well as the distances between them. Nodes not located directly on a pier are placed at the centerline between structural supports (the theoretical weakest point) for a worst-case measurement.
Figure 3 - Schematic representation of the location of eight instrumentation nodes (Nx) and relays (Rx) used to monitor bridge health.
Data acquisition challenges require unique solutions
Measurement nodes are sensor clusters of as many as twenty-six devices, and as you can see from Figure 3, the distances between measurement nodes can be great. Further, the plan was to establish a computer system in a blockhouse that is located approximately 340-feet from the northbound exit of the bridge. The computer would connect to a data acquisition system and provide 24/7/365 monitoring of bridge condition with remote access. This created two major data acquisition problems for the application that needed to be solved before the goal of a monitoring system for the I-35W Bridge could be realized.
The total number of channels that needed to be acquired was sixty-two, which is not an over whelming number given contemporary data acquisition solutions. However, running signal leads from sixty-two sensors to one central location is not practical. The optimal location for a single data acquisition system is at the middle of the bridge (at nodes 2 or 6), and as can be seen from Figure 3, this would result in signal paths that exceed 400 feet in some cases. The typical millivolt-level signals would experience line loss and induced noise over this distance that would degrade measurements to the point of making them useless for the purpose intended. Further, stringing shielded, multi-conductor signal cable over such a great distance is problematic and costly. For these reasons a single data acquisition approach was abandoned.
A second option was to install a data acquisition system at each measurement node, resolving the problems created by one centralized data acquisition system. Signal cable lengths would be minimized, and connecting them to the data acquisition system over these short distances would
be both practical and cost-effective. But the problem was how to synchronize eight data acquisition systems distributed across over 1,800 feet of northbound and southbound bridge segments.
The need for channel synchronization is crucial to the success of subsequent data analysis and bridge performance interpretation. Each one of the sixty-two measured channels needs to be acquired in a predictable time slot relative to the others. Without this, an event on one channel cannot be interpreted in terms of other channels, so the effect of that event on the bridge's structure as a whole is lost forever. It would be like trying to interpret a verbal sentence where the words arrive at your ear in a different order than when they were spoken.
Although the synchronization problem is inherently solved with one centralized data acquisition system, it's a major challenge to synchronize multiple systems spread out over 1,800 feet.
Synchronous Data Acquisition Using Ethernet
The ideal instrumentation solution for the I-35W Bridge allows one data acquisition system per node to maintain signal integrity and low cabling cost, and also provides the ability to synchronize between multiple systems that are dispersed across the eight measurement nodes with over 2,000 feet separating the data gathering computer and the last node. DATAQ Instruments' synchronous Ethernet data acquisition products provided such a solution.
DATAQ Instruments' OEM type DI-5001 data acquisition cards were supplied with Ethernet interfaces, one per data acquisition node. Each board supports 32 analog channels to accommodate one sensor input per channel, and features dual RJ45 connectors that allow standard CAT-5 Ethernet cable to simply daisy chain between the eight DI-5001 boards, one per instrument node. This approach keeps transducer signal leads short, substituting low cost CAT-5 Ethernet cable for the long runs between nodes. The daisy chained Ethernet approach also solved other problems. It supports modularity and expansion so that nodes could be easily swapped, added or removed to increase or decrease node count, as the application requires. The fact that Ethernet is an isolated standard means that data communication reliability is bulletproof even in the presence of common mode voltages. Finally, it allows exceedingly long communication cable lengths of up to 100 meters between units. Since the data acquisition system's synchronous interface provides a built-in Ethernet switch, the distance between individual nodes, and between them and the block house can be as long as 100 meters.
The synchronizing mechanism incorporates two unused CAT-5 cable pairs. One pair carries a master 16 MHz clock, and the second carries a trigger signal. The clock is daisy-chained between DI-5001 units, and the Ethernet interface of each unit incorporates a phase lock loop (PLL) that provides failsafe operation and exactly reproduces the master clock with zero phase delay. The failsafe feature is a unique aspect of the PLL that ensures that lock is maintained in the event of momentary, or even longer-term interruptions in the daisy-chained master clock. The incorporation of PLLs into the Ethernet interface of each DI-5001 ensures that each data acquisition unit remains precisely synced to the master clock in frequency as well as in phase, thereby guaranteeing synchronous analog to digital conversions between individual units and between individual channels. The addition of a master trigger signal on the second CAT-5 cable pair completes the picture to ensure that all units in the distributed chain initiate sampling at the same instant, unencumbered by network latencies.
Referring again to Figure 3, in situations where distances between nodes or the computer exceed 100 meters, a relay is used to bridge the gap. Model DI-789 relays, denoted as Rx in Figure 3, are specially designed to carry data and synchronous timing signals between nodes and ultimately to the connected computer for display and storage.
Data Acquisition Software
The transducers and the hardware used to achieve synchronous operation is only half of the solution. Also required was continuous monitoring of the bridge, 24/7/365. That meant a dedicated computer running software that is able to deliver a continuous stream of acquired data from each instrumentation node to the computer's hard drive for permanent storage. The result would be large data files that require an efficient method to review data.
DATAQ Instruments' WinDaq software provided a solution that satisfied the need to acquire data continuously from each node though use of its disk streaming capability. Each channel of every node is continuously sampled, some as fast as 1 kHz, yielding approximately 2 GB data files each day after data reduction, and each value in the resulting data files is time and date stamped to correlate any given event with an actual date and time of occurrence.
Reviewing data is fast and efficient through the use of WinDaq software's playback component. Specific events can be easily identified and exported to other applications for further analysis. Figure 4 is a compressed playback screen showing the northbound progression of a large vehicle across the bridge the afternoon of March 30, 2009. Starting at the bottom of the screen, moving toward the top, and correlating it with the bridge schematic of Figure 3, we can clearly see that the vehicle is first detected by node 3 accelerometers on the first bridge span (SP1, channels 6 and 5), then by node 2 accelerometers on the second bridge span (SP2, channels 4 and 3), and finally by accelerometers of node 1 on the third and final bridge span (SP3, channels 2 and 1).
Figure 4 - The progression of a lone heavy vehicle traveling northbound on the I35W Bridge as detected by accelerometers at instrument nodes 3, 2, and 1 (refer to Figure 3).
In another example, Figure 5 details the movement with temperature of three northbound and two southbound bridge expansion joints over a twenty-four hour period. The measurements were taken from several linear potentiometers (LPs) calibrated in inches. Beginning again at the bottom of the screen and moving up, first are the LPs of node 4 that measure the expansion of span 1 southbound lanes (SP1, channels 6 and 5). Next are node 4 LP sensors that measure complementary positions on the northbound lanes (SP1, channels 4 and 3). And finally node 1 LP sensors measuring expansion joint activity for northbound lanes at span 3 (SP3, channels 2 and 1).
Figure 5 - The activity of expansion joints as a function of temperature as measured by linear potentiometers over a twenty-four hour period. Measurements were taken at nodes 1 and 4 (see Figure 3).
A final example of day-to-day activities on the I35W Bridge and the sensitivity of the instruments that detect them can be found in Figure 6. The havoc created by a snowplow at 7:32 AM on April 6, 2009, as detected by an accelerometer located at node 3 in the northbound lanes, can be seen in the enclosed box. Compare the enclosed section with the relative calm both before and after the plow passes in this highly compressed plot.
Figure 6 - The activity of a snowplow on April 6, 2009 at 07:37 AM is detected by an accelerometer located on the first span of the northbound lanes at instrument node 3.
Conclusions
Constant monitoring of Saint Anthony Falls Bridge vital signs will provide unprecedented insight to bridge condition for the life of the structure. The evaluation of wear and tear no longer needs to be solely a subjective manual inspection exercise. Now it can be supplemented by quantitative analysis that evaluates bridge performance on an annual, monthly, and even daily basis if necessary, making manual modes of inspection that much more productive. Advanced data acquisitions systems are at the heart of this process. Due to the constraints of bridge length and the number and diversity of measurement points and types, only a synchronous data acquisition system could produce meaningful results. Ethernet data acquisition products by DATAQ Instruments fulfilled this requirement with hardware and software solutions that will generate multi-channel data files describing bridge condition far into the future.
(信息来源:DATAQ Instruments)
关于结构健康监测
结构健康监测是指对工程结构实施损伤检测和识别。 我们这里所说的损伤包括材料特性改变或结构体系的几何特性发生改变,以及边界条件和体系的连续性,体系的整体连续性对结构的服役能力有至关重要的作用。 结构健康监测涉及到通过分析定期采集的结构布置的传感器阵列的动力响应数据来观察体系随时间推移产生的变化,损伤敏感特征值的提取并通过数据分析来确定结构的健康状态。对于长期结构健康监测,通过数据定期更新来估计结构老化和恶劣服役环境对工程结构是否有能力继续实现设计功能。
关于光纤光栅传感器
光纤光栅传感器(Fiber Grating Sensor )属于光纤传感器的一种,基于光纤光栅的传感过程是通过外界物理参量对光纤布拉格(Bragg)波长的调制来获取传感信息,是一种波长调制型光纤传感器。光纤光栅传感器可以实现对温度、应变等物理量的直接测量。由于光纤光栅波长对温度与应变同时敏感,即温度与应变同时引起光纤光栅耦合波长移动,使得通过测量光纤光栅耦合波长移动无法对温度与应变加以区分。因此,解决交叉敏感问题,实现温度和应力的区分测量是传感器实用化的前提。通过一定的技术来测定应力和温度变化来实现对温度和应力区分测量。这些传感器主要包括光纤光栅应变传感器、温度传感器、加速度传感器、位移传感器、压力传感器、流量传感器、液位传感器等。
关于聚华科技
杭州聚华光电科技有限公司(Cavono,Inc.)是一家基于物联网光纤传感器技术从事土木工程结构健康监测与预警管理的高新技术企业,聚华是光纤光栅传感器产品提供商和土木工程结构健康监测一站式解决方案优质合作伙伴。公司专注于桥梁、隧道、边坡、基坑、地铁、矿山、电力等土木工程领域的结构健康监测相关产品的研发、生产、推广与应用,以提供野外光纤传感器自动化监测产品、工程结构安全监测一站式解决方案见长。主要以光纤光栅传感器技术、分布式光纤测温技术、工程安全自动化云计算软件、工程化专业领域数据分析为技术核心。www.cavono.com www.juhualab.com

Copyright © 2014 CAVONO LAB. 聚华光纤传感实验室 版权所有 浙ICP备14036525号-2 站点统计